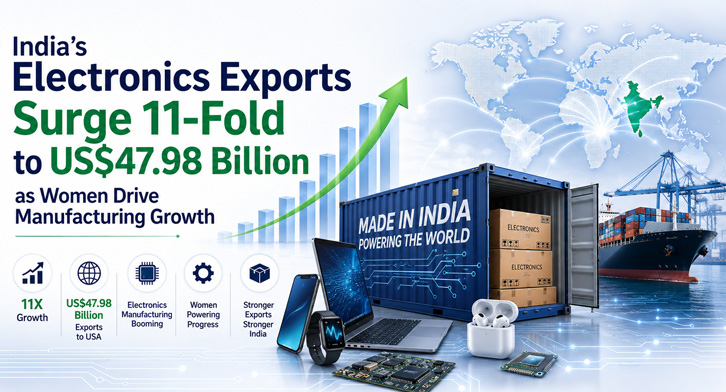
India’s Electronics Exports Surge 11-Fold to US$47.98 Billion as Women Drive Manufacturing Growth

India’s electronics manufacturing industry has emerged as one of the country’s fastest-growing export sectors, with electronics exports rising more than 11-fold to Rs. 4.24 lakh crore (US$47.98 billion) in FY2025-26 from Rs. 38,000 crore (US$6.21 billion) in FY2014-15.
The rapid expansion has strengthened India’s position in global electronics manufacturing while creating significant employment opportunities, particularly for women. Women now account for nearly 30% of the workforce across the broader electronics manufacturing ecosystem, while their participation in mobile phone manufacturing is estimated at around 70%.

The sector’s transformation has been supported by government programmes such as the Production Linked Incentive (PLI) Scheme, Electronics Components Manufacturing Scheme (ECMS), India Semiconductor Mission (ISM), and Modified Electronics Manufacturing Clusters (EMC 2.0).

Key Highlights

Electronics Exports: From Emerging Sector to Major Export Engine

Electronics goods have become India’s third-largest export category, reflecting a major shift in the country’s export profile.
In FY2014-15, electronics exports stood at just Rs. 38,000 crore. By FY2025-26, the figure had climbed to Rs. 4.24 lakh crore, equivalent to US$47.98 billion.

India’s Electronics Export Growth

Indicator

FY2014-15

FY2025-26

Growth

Electronics exports

Rs. 38,000 crore

Rs. 4.24 lakh crore

More than 11X

Electronics production

Rs. 18,000 crore

Rs. 6.27 lakh crore

Significant expansion

Mobile phone exports

Rs. 1,500 crore

Rs. 2.59 lakh crore

165X

Mobile phone export value

US$245.3 million

US$29.30 billion

Major increase

Wireless data costs have declined from Rs. 308 per GB in 2014 to Rs. 7.51 per GB in 2026, making mobile internet substantially more affordable for consumers and businesses.
Meanwhile, average mobile broadband download speeds increased from 13.67 Mbps in March 2022 to 132 Mbps in December 2025.

5G Expansion Strengthens India’s Digital Infrastructure

India’s telecommunications infrastructure has also expanded rapidly.
As of June 2026, 5G services were available in 99.9% of districts across States and Union Territories, supported by approximately 5.63 lakh 5G Base Transceiver Stations.
This expanding connectivity creates a stronger foundation for digital commerce, cloud services, AI adoption, connected logistics, smart manufacturing and Industry 4.0 applications.

Why India’s Electronics Growth Matters for Logistics

The expansion of electronics manufacturing has important implications for India’s logistics and supply chain sector.
Electronics products and components typically require time-sensitive transportation, inventory visibility, secure handling and efficient multimodal connectivity. As production and exports increase, manufacturers and logistics providers are likely to require more sophisticated supply chain capabilities.
For freight forwarders, the growth of electronics exports could translate into increased demand for air freight, ocean freight, customs clearance, warehousing, cargo tracking and international shipment management.

What This Means for India’s Export Economy

India’s electronics industry is increasingly becoming a strategic pillar of the country’s export ambitions.
The combination of rising production, stronger component manufacturing, growing mobile phone exports, expanding digital infrastructure and increasing global supply-chain integration is creating a broader electronics ecosystem.
The shift is particularly significant because electronics manufacturing can generate value across multiple stages of the supply chain — from components and assembly to logistics, testing, packaging and exports.

India’s Electronics Industry Gains Global Momentum

India’s electronics sector is undergoing a structural transformation, moving from a relatively small export segment to a major contributor to the country’s manufacturing and trade ecosystem.
With electronics exports reaching US$47.98 billion, mobile phones emerging as India’s largest export product and millions of new jobs being created, the sector is becoming increasingly important to India’s global trade strategy.
The combination of manufacturing incentives, semiconductor investments, digital connectivity and improving logistics infrastructure could further strengthen India’s position in global electronics supply chains. For logistics companies and freight forwarders, this growth also points towards expanding opportunities in electronics cargo movement, international freight, customs, warehousing, tracking and technology-enabled supply chain management.

Frequently Asked Questions

How much did India’s electronics exports reach in FY2025-26?
India’s electronics exports reached Rs. 4.24 lakh crore (US$47.98 billion) in FY2025-26.
Electronics exports increased more than 11-fold, rising from Rs. 38,000 crore in FY2014-15 to Rs. 4.24 lakh crore in FY2025-26.
Mobile phone exports increased 165 times, from Rs. 1,500 crore in FY2014-15 to Rs. 2.59 lakh crore in FY2025-26.
The electronics manufacturing sector has generated approximately 12 lakh jobs.
Women account for nearly 70% of the workforce in mobile manufacturing.
Key programmes include the PLI Scheme, Electronics Components Manufacturing Scheme, India Semiconductor Mission and Modified Electronics Manufacturing Clusters 2.0.
5G services are available in approximately 99.9% of districts across States and Union Territories.
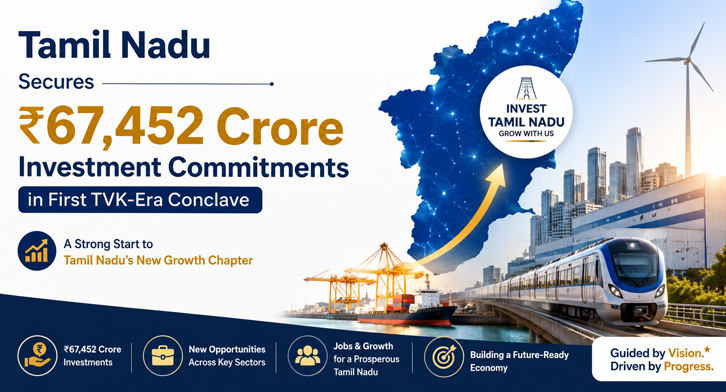
Tamil Nadu Secures ₹67,452 Crore Investment Commitments in First TVK-Era Conclave

Tamil Nadu has secured investment commitments worth ₹67,452 crore through 97 memoranda of understanding (MoUs), with projects expected to generate nearly 1.07 lakh jobs, at the state government’s first major investment conclave under the new administration.
The Vetri Tamil Nadu Investors’ Conclave, held in Chennai on August 13, brought together companies from data centres, automobiles, electric vehicles, electronics, aerospace, renewable energy, textiles and engineering. The agreements include 56 greenfield projects, while several existing companies have also announced expansion plans.
The investment push is significant for Tamil Nadu’s industrial and logistics ecosystem because the projects are spread across more than 20 districts and include both established manufacturing clusters and emerging technology sectors.

Key Highlights

Sector-Wise Investment Commitments

Sector

Investment Commitment

Data Centres

₹26,417 crore

Automotive

₹17,073 crore

Renewable Energy

₹15,787 crore

Engineering

₹9,525 crore

Other sectors

Balance of commitments

Total

₹67,452 crore

Figures are based on government-reported commitments and sector-wise figures reported following the conclave.

Data Centres Lead Tamil Nadu's Investment Push

The data centre industry emerged as the biggest investment driver, with commitments of ₹26,417 crore.
One of the largest individual announcements came from Lighthouse Green Data Centre, which committed ₹10,000 crore for a hyperscale data centre in Thoothukudi.
Nxtra by Airtel announced ₹1,417 crore to expand its Chennai campus and establish an edge data centre in Tiruchirappalli.
The concentration of data-centre investments is particularly important for the logistics sector. Large digital infrastructure facilities require reliable power, connectivity, equipment movement, specialised warehousing and efficient last-mile supply chains.

Aerospace and Space-Tech Investments Expand in Thoothukudi

Tamil Nadu is also positioning Thoothukudi as an emerging aerospace and space-technology manufacturing hub.
Skyroot Aerospace signed an MoU for a ₹250-crore facility in Thoothukudi for storage, assembly, integration and testing activities.
Agnikul Cosmos committed ₹400 crore for a launch-vehicle assembly and integration facility. The investments are expected to strengthen the industrial ecosystem developing around the Kulasekarapattinam spaceport.
The combination of aerospace manufacturing, port infrastructure and emerging space-launch capabilities could create new demand for specialised logistics, high-value cargo handling and time-critical transportation.

Automotive and EV Manufacturing Remain Strong

The automotive sector attracted ₹17,073 crore in commitments, reinforcing Tamil Nadu’s position as one of India’s major automobile and component manufacturing centres.
Major announcements included:
The expansion of EV and automotive component manufacturing could further increase demand for inbound raw-material logistics, component transportation, warehousing and finished-vehicle distribution.

Electronics and AI Infrastructure Gain Momentum

Tamil Nadu’s investment pipeline also includes projects focused on electronics, AI infrastructure and semiconductor-related manufacturing.
Supermicro, the US-based server manufacturer, signed an MoU for a ₹477-crore facility in Chennai for AI-server manufacturing.
Avalon Technologies committed ₹1,000 crore for electronic components in Kanchipuram.
The semiconductor and advanced-electronics pipeline also includes investments in semiconductor equipment, bonding materials, reliability testing and related manufacturing capabilities.
This could strengthen Tamil Nadu’s position in the wider electronics supply chain while creating additional demand for specialised freight, component logistics and technology-enabled inventory management.

Textile Investments Add Depth to Regional Industrial Growth

The investment push is not limited to technology and heavy industry.
MAS India committed ₹880 crore for apparel, textiles and wearable technology manufacturing across multiple districts, with around 7,000 jobs expected.
Pallava Group announced ₹1,000 crore for man-made fibre manufacturing, while RB Wovens committed ₹675 crore for home textiles at the upcoming PM-MITRA textile park in Virudhunagar.
These projects could help distribute industrial investment beyond Tamil Nadu’s established manufacturing corridors.

Major Companies and Project Commitments

Company

Investment

Location

Key Activity

Lighthouse Green Data Centre

₹10,000 crore

Thoothukudi

Hyperscale data centre

JK Tyre

₹5,143 crore

Kanchipuram

Tyre manufacturing

Daimler

₹4,000 crore

Tamil Nadu

BharatBenz manufacturing & product development

Hinduja Group

₹2,500 crore

Tamil Nadu

Solar, wind, battery & mobility

Lucas TVS

₹2,500 crore

Tamil Nadu

EV & automotive components

Saint-Gobain

₹2,000 crore

Krishnagiri /
Kanchipuram

Manufacturing & expansion

YKK

₹1,651 crore

Thiruvallur

Zipper manufacturing

Nxtra by Airtel

₹1,417 crore

Chennai/Trichy

Data centres

Avalon Technologies

₹1,000 crore

Kanchipuram

Electronics

Titan

₹1,000 crore

Hosur

Watches & electronics automation

Ultraviolette Automotive

₹779 crore

Krishnagiri

Electric motorcycles

Agnikul Cosmos

₹400 crore

Thoothukudi

Launch-vehicle assembly

Skyroot Aerospace

₹250 crore

Thoothukudi

Space launch vehicles

Supermicro

₹477 crore

Chennai

AI-server manufacturing

Investment figures represent announced MoU commitments and should not be treated as immediately deployed capital.

Investment Flow and Logistics Impact

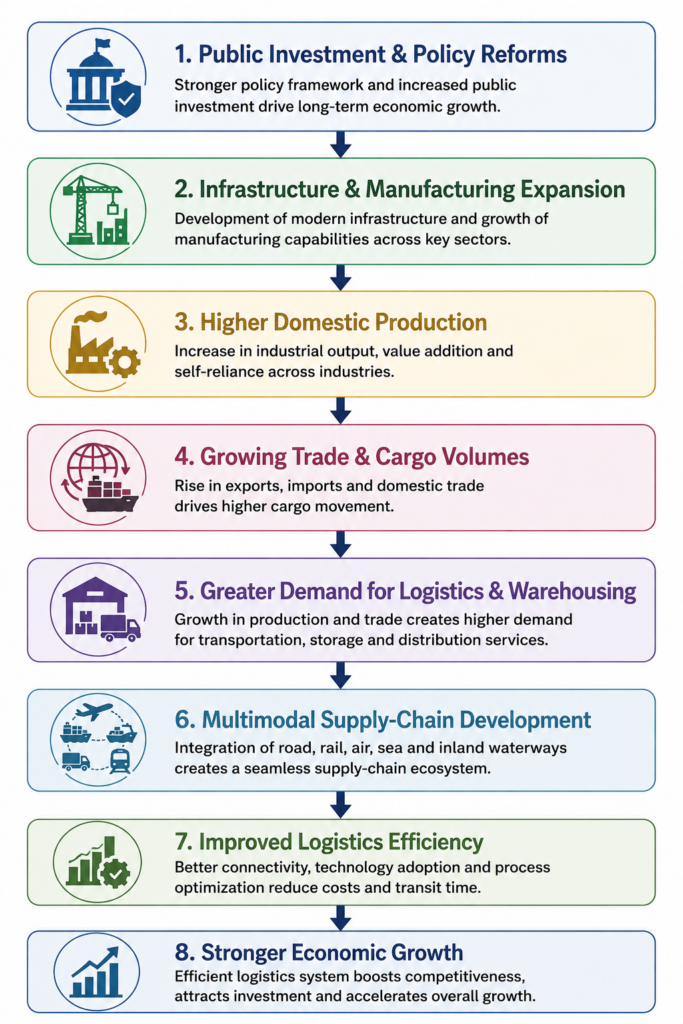
The investment pipeline creates a potential chain reaction across Tamil Nadu’s industrial and logistics ecosystem:

Why This Matters for Logistics

For freight forwarders, 3PL providers, warehouse operators and transport companies, the new investment pipeline could create opportunities in several areas:

Thoothukudi Emerges as a New Investment Hotspot

One of the most notable developments is the growing investment concentration in Thoothukudi.
The district is attracting projects spanning hyperscale data centres and private space-sector manufacturing. The combination of port connectivity, industrial infrastructure and the developing space ecosystem could make the region increasingly important for project cargo and specialised logistics.
The aerospace investments from Skyroot and Agnikul, alongside Lighthouse Green Data Centre’s ₹10,000-crore proposal, underline the potential for Thoothukudi to emerge as a diversified industrial and logistics hub.

Tamil Nadu's First-100-Day Investment Picture

The latest conclave takes the state’s cumulative investment commitments during the government’s first 100 days to ₹1,02,514 crore, according to the Tamil Nadu government.
The commitments are expected to generate approximately 1,21,788 jobs when the earlier agreements and the latest conclave commitments are combined.
The state government has also indicated that it intends to accelerate project approvals, with a stated 21-day deadline for approvals, licences and no-objection certificates (NOCs).

What This Means for India's Logistics Sector

Tamil Nadu’s latest investment drive goes beyond the headline investment number. The diversity of projects—from AI servers and data centres to EVs, aerospace, textiles and renewable energy—could create a broader and more complex logistics network across the state.
For logistics companies, this could mean higher cargo volumes, more specialised shipments, greater warehousing demand and increased need for real-time freight visibility.
For exporters, the expansion of manufacturing capacity could strengthen Tamil Nadu’s role in global supply chains, particularly in automobiles, electronics, textiles, engineering and emerging technology products.

Tamil Nadu’s Investment Boom Opens New Opportunities for Logistics

Tamil Nadu’s ₹67,452-crore investment pipeline signals an aggressive expansion across manufacturing, digital infrastructure, EVs, aerospace, electronics, renewable energy and textiles.
For the logistics industry, the significance could extend well beyond the investment announcements themselves. As these projects move from MoUs to construction, commissioning and commercial production, they could generate sustained demand for project cargo, freight forwarding, warehousing, multimodal transportation and supply-chain technology across Tamil Nadu.

Frequently Asked Questions

How much investment did Tamil Nadu attract at the 2026 Vetri Tamil Nadu Investors' Conclave?
Tamil Nadu secured investment commitments of ₹67,452 crore through 97 MoUs, according to the state government.
The 97 MoUs are expected to create approximately 1,06,998 jobs.
Data centres received the largest sector-wise commitment at approximately ₹26,417 crore.
Major announcements included Lighthouse Green Data Centre, JK Tyre, Daimler, Lucas TVS, Hinduja Group, Saint-Gobain, YKK, Nxtra by Airtel, Avalon Technologies, Titan, Skyroot Aerospace and Agnikul Cosmos.
Thoothukudi is attracting major projects in data centres and aerospace, including Lighthouse Green Data Centre’s ₹10,000-crore proposal and investments from Skyroot Aerospace and Agnikul Cosmos.
According to the state government, cumulative investment commitments reached ₹1,02,514 crore in the first 100 days, with projected employment of 1,21,788 people.

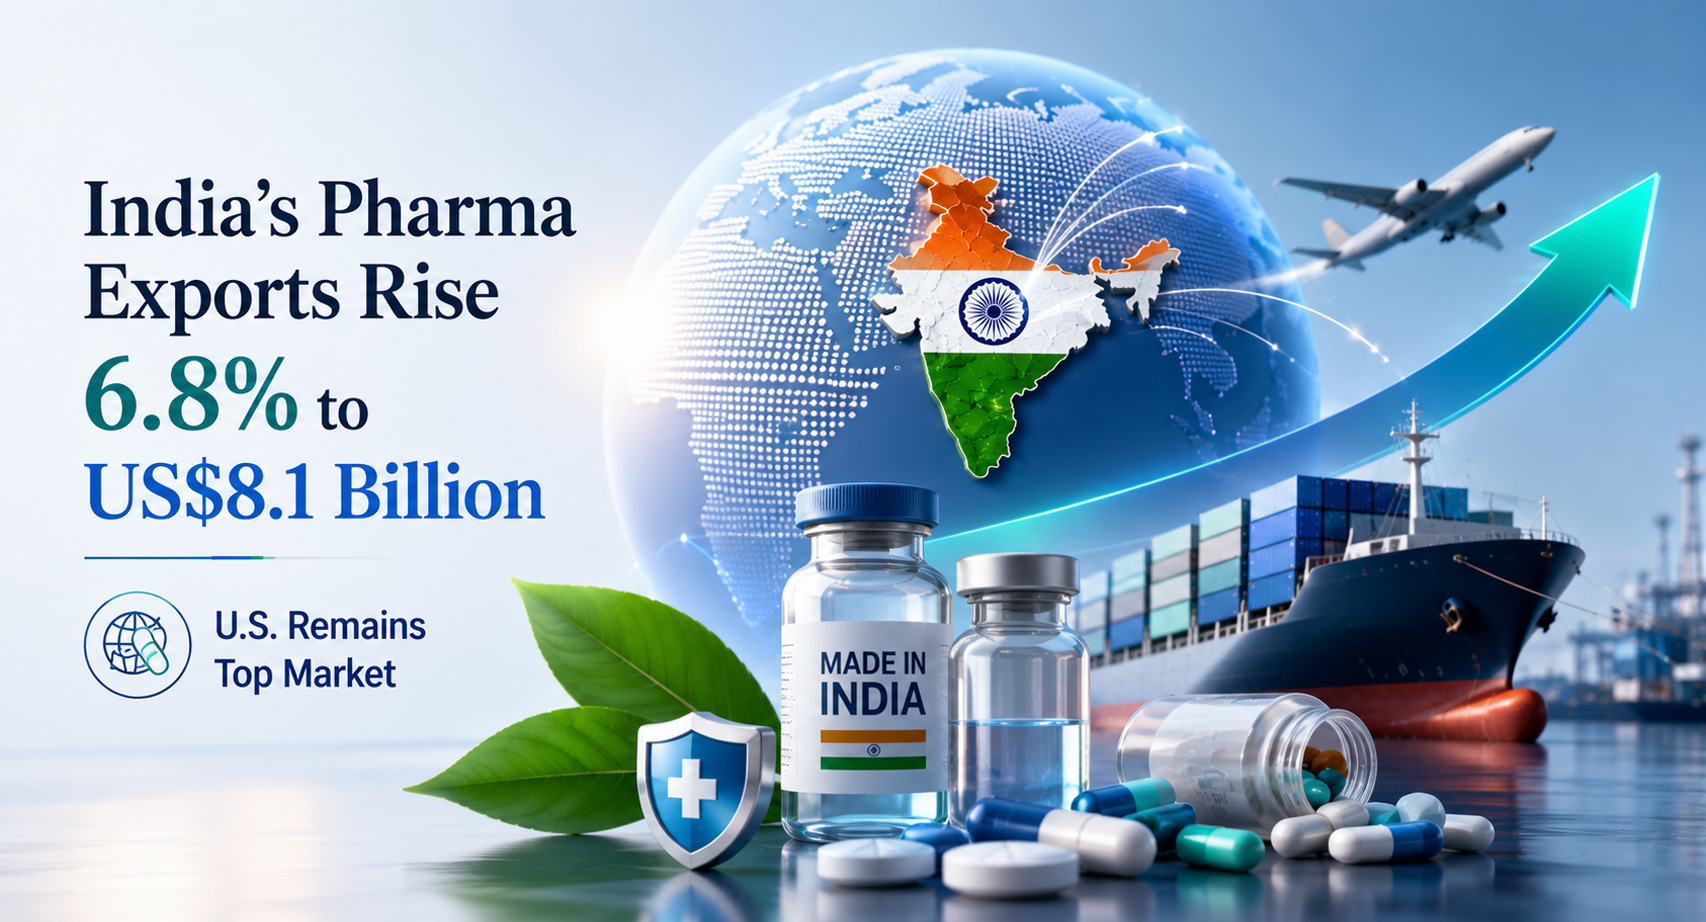
India’s Pharma Exports Rise 6.8% to US$8.1 Billion in Q1 FY2026-27; U.S. Remains Top Market

India’s pharmaceutical exports recorded a strong start to FY2026-27, rising 6.8% year-on-year to US$8.1 billion in Q1, according to data from the Pharmaceuticals Export Promotion Council of India (Pharmexcil).
The growth highlights continued international demand for Indian medicines, particularly generic drugs, vaccines and pharmaceutical intermediates. The United States remained India’s largest pharmaceutical export market, accounting for US$2.50 billion, or nearly 31% of total pharma exports during the quarter.
The latest performance reinforces India’s position as a major global pharmaceutical manufacturing and export hub, supported by competitive production capabilities, regulatory compliance and expanding market diversification.

Key Highlights

Pharma Formulations Lead India’s Export Basket

Drug formulations and biologicals continued to dominate India’s pharmaceutical export basket during Q1, generating US$5.98 billion in export revenue.
This category accounted for approximately 73.85% of India’s total pharmaceutical exports and grew 4.14% compared with the same period a year earlier.
Bulk drugs and drug intermediates recorded stronger growth, increasing 13.84% to US$1.36 billion. Vaccine exports delivered one of the fastest growth rates, jumping 35.68% to US$390 million.

India Pharmaceutical Export Categories — Q1 FY2026-27

Export Category

Q1 Export Value

YoY Growth

Share/Significance

Drug formulations & biologicals

US$5.98 bn

4.14%

73.85% of total

Bulk drugs & intermediates

US$1.36 bn

13.84%

2nd-largest category

Vaccines

US$0.39 bn

35.68%

Fastest-growing major category

Surgical products

US$0.21 bn

11.95%

Strong double-digit growth

Total pharmaceutical exports

US$8.10 bn

6.80%

Q1 FY2026-27

U.S. Continues to Drive India’s Pharmaceutical Exports

The United States remained India’s largest pharmaceutical export destination, with shipments valued at approximately US$2.50 billion during Q1.
The U.S. accounted for 30.89% of India’s pharmaceutical exports, underlining the importance of the American market to India’s pharmaceutical manufacturing and export ecosystem.
Brazil, the United Kingdom, the Netherlands and France followed the U.S. among India’s leading country-level export destinations.
The top 25 destinations collectively accounted for nearly 70% of India’s pharmaceutical exports, with shipments worth approximately US$5.65 billion, representing 5.50% year-on-year growth.

Top Pharmaceutical Export Markets

Rank

Market

Q1 Export Value / Position

1

United States

US$2.50 billion

2

Brazil

Major growth market

3

United Kingdom

Key developed market

4

Netherlands

Major European destination

5

France

Growing European market

India’s Pharmaceutical Export Growth Is Becoming More Diversified

While North America continues to be a critical market, India’s pharmaceutical exports are increasingly spread across multiple regions.
North America, Europe, Africa and Latin America & the Caribbean collectively represented nearly three-fourths of India’s pharmaceutical exports during the quarter.
Double-digit growth across several regions, including Europe, Africa, Latin America, ASEAN and South Asia, points to increasing geographical diversification.
This diversification could help Indian pharmaceutical exporters reduce their dependence on individual markets while creating opportunities across emerging healthcare markets.

Growth Drivers Behind India’s Pharma Export Performance

Several factors are supporting the expansion of India’s pharmaceutical exports:
1. Strong Global Demand for Generics
Indian manufacturers remain major suppliers of affordable generic medicines to healthcare systems around the world.
2. Expanding Vaccine Exports
Vaccine shipments grew by more than 35% during Q1, demonstrating India’s continued strength in vaccine manufacturing and international supply.
3. Growing Pharmaceutical Intermediates Demand
Exports of bulk drugs and drug intermediates increased 13.84%, reflecting demand for pharmaceutical inputs and India’s expanding role in global supply chains.
4. Market Diversification
Increasing exports to Europe, Africa, ASEAN, South Asia and Latin America are broadening India’s pharmaceutical trade footprint.
5. Manufacturing Scale and Regulatory Capability
India’s combination of manufacturing capacity, competitive costs, regulatory experience and established global supply relationships continues to support pharmaceutical exports.

June Pharma Exports Also Show Strong Momentum

India’s pharmaceutical exports continued to perform strongly in June.
Pharmaceutical shipments increased 7.13% year-on-year to US$2.81 billion, compared with approximately US$2.62 billion in June of the previous year.
June exports were also 6.86% higher than the US$2.63 billion recorded in May FY2026-27, indicating continued momentum at the beginning of the new financial year.

India’s FY2025-26 Pharma Exports Cross US$31 Billion

India’s pharmaceutical exports reached approximately US$31.11 billion in FY2025-26, representing growth of more than 2% compared with the previous financial year.

The latest Q1 performance suggests that pharmaceutical exports remain an important contributor to India’s broader merchandise export strategy.

What This Means for Global Logistics

The growth in pharmaceutical exports also has implications for the logistics and supply chain industry.
Pharmaceutical products require tightly controlled transportation, documentation and compliance processes. Rising export volumes can increase demand for:
For freight forwarders and logistics providers, India’s expanding pharmaceutical trade represents an opportunity to develop more specialized pharma logistics and healthcare supply-chain solutions.

Conclusion

India’s 6.8% growth in pharmaceutical exports to US$8.1 billion during Q1 FY2026-27 signals continued strength in one of the country’s most strategically important export sectors.
The United States remains the dominant market, but strong growth across Europe, Africa, Latin America, ASEAN and South Asia indicates that Indian pharmaceutical companies are increasingly diversifying their global presence.
With vaccine exports, pharmaceutical intermediates and other categories recording strong growth, India’s pharmaceutical industry is positioned to play an increasingly important role in global healthcare supply chains.
For the logistics industry, the trend also points to rising demand for specialized pharma freight forwarding, cold-chain logistics, compliance, visibility and digitally managed supply chains.

Frequently Asked Questions

What was India’s pharmaceutical export value in Q1 FY2026-27?
India exported pharmaceutical products worth approximately US$8.1 billion in Q1 FY2026-27, representing 6.8% year-on-year growth.
The United States remained India’s largest pharmaceutical export destination, with exports of approximately US$2.50 billion, representing 30.89% of total pharmaceutical exports during the quarter.
Drug formulations and biologicals were the largest category, generating approximately US$5.98 billion and accounting for 73.85% of India’s pharmaceutical exports.
Vaccine exports recorded the strongest growth among the major categories, increasing 35.68% year-on-year to US$0.39 billion.
India’s pharmaceutical exports reached approximately US$31.11 billion in FY2025-26, growing by more than 2% year-on-year.
Pharmaceutical exports require specialized supply-chain capabilities, including temperature-controlled transportation, regulatory documentation, cargo tracking, secure warehousing and fast customs clearance. Rising export volumes can therefore increase demand for specialized pharmaceutical logistics services.

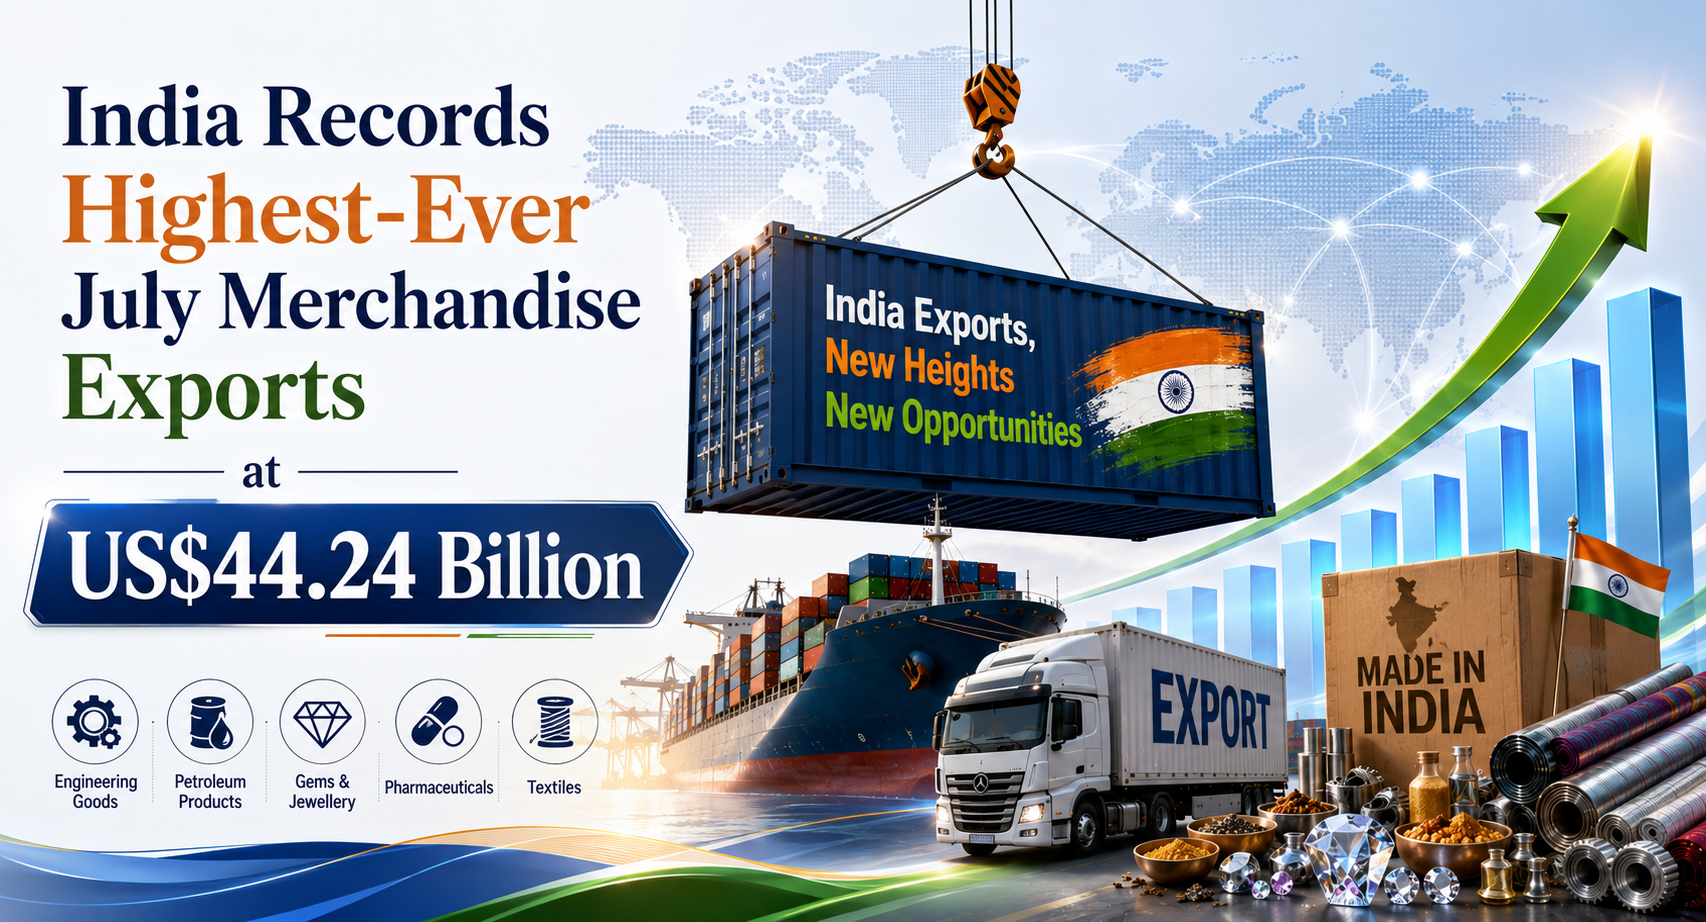
India Records Highest-Ever July Merchandise Exports at US$44.24 Billion

India’s merchandise exports reached a record US$44.24 billion in July 2026, registering growth of more than 19% year-on-year (YoY) and marking the country’s highest-ever merchandise export value for the month of July.
The strong performance comes despite continued pressure on global trade from geopolitical tensions, shipping disruptions, elevated freight costs and volatility across international markets.
The latest export numbers underline the resilience of Indian exporters and the growing contribution of manufacturing and value-added products to India’s international trade.

Key Highlights

July Export Growth Signals Stronger Trade Resilience

The July export performance is particularly significant because Indian exporters achieved record shipments while international supply chains continue to face disruptions.
According to Federation of Indian Export Organisations (FIEO) President S. C. Ralhan, the more than 19% increase demonstrates the resilience, competitiveness and adaptability of Indian exporters.
Higher transportation costs, uncertain shipping schedules and changing global trade conditions have created additional challenges for exporters. Despite these pressures, Indian businesses have continued to expand their presence across international markets.
The performance also suggests that India’s export growth is becoming increasingly diversified, with manufacturing and value-added sectors playing a larger role.

India’s April-July Export Performance

The positive momentum extends beyond July.
Between April and July 2026-27, India’s merchandise exports increased 17.04% to US$173.78 billion.
When merchandise and services are combined, India’s total exports reached US$316.42 billion, representing growth of 13.16%.

India Export Performance: April-July 2026-27

Trade Indicator

Value

Growth

Merchandise exports

US$173.78 billion

17.04%

Merchandise + services exports

US$316.42 billion

13.16%

Non-petroleum exports

—

12.79%

Merchandise imports

—

19.27% growth

Overall imports

US$365.85 billion

Increased from US$311.94 billion

Overall trade deficit

US$49.43 billion

Up from US$32.32 billion

The 12.79% growth in non-petroleum exports is particularly important because it points to broader export expansion beyond petroleum-linked trade.

Engineering Goods Lead India’s Export Basket

Engineering goods remained the largest export category, highlighting the increasing importance of India’s manufacturing sector in global trade.

Other major export categories included:

The strong representation of engineering, electronics, pharmaceuticals, chemicals and other manufactured products indicates a gradual shift towards higher-value and manufacturing-oriented exports.

Export Category

Significance

Engineering goods

Major manufacturing export

Petroleum products

Gulf-India-East Africa (GIEA)

Electronic goods

Reflects India's expanding electronics manufacturing

Drugs & pharmaceuticals

Strong global demand

Organic & inorganic chemicals

Important industrial export segment

Gems & jewellery

Traditional high-value export

Readymade garments

Labour-intensive export sector

Cotton yarn, fabrics & made-ups

Textile supply chain

Rice

Major agricultural export

Plastic & linoleum

Industrial and consumer products

US, UAE and Singapore Among Key Export Markets

India’s export growth is also supported by a broad geographical spread.
During April-July 2026-27, the United States, UAE, Singapore, China, Netherlands, United Kingdom, Germany, South Africa, Bangladesh and Tanzania were among India’s leading export destinations.
The diversification of export markets is becoming increasingly important as businesses seek to reduce their exposure to individual markets and manage geopolitical and trade-policy risks.

India's Key Export Destinations

The growing presence of Indian products in markets across the Gulf, Europe, Africa and Asia could provide exporters with additional opportunities for market expansion.

Trade Deficit Remains a Major Concern

Despite the strong export performance, India continues to face pressure from rapidly rising imports.
Merchandise imports reached US$76.22 billion in July, resulting in a merchandise trade deficit of US$31.98 billion.
During April-July, merchandise imports increased by 19.27%, faster than the 17.04% growth in merchandise exports.
This gap remains an important issue for policymakers because faster import growth can offset part of the gains achieved through higher exports.
India’s Import and Trade Deficit Snapshot

Indicator

April-July Comparison

Merchandise export growth

17.04%

Merchandise import growth

19.27%

Overall imports

US$365.85 billion

Previous overall imports

US$311.94 billion

Current overall trade deficit

US$49.43 billion

Previous overall trade deficit

US$32.32 billion

India’s Export Growth: From Production to Global Markets

The latest figures illustrate how stronger domestic manufacturing capacity can translate into increased participation in international supply chains.
For freight forwarders, shipping companies and logistics providers, sustained export growth could also translate into higher demand for international freight, customs clearance, documentation, cargo tracking, warehousing and multimodal transportation services.

Logistics Disruptions Remain a Key Risk

The record export figure comes at a time when global logistics remains vulnerable to disruptions.
Exporters continue to deal with:
For exporters, efficient logistics management has therefore become increasingly important.

The ability to compare freight rates, manage documentation, track shipments, coordinate carriers and monitor logistics costs can help businesses respond faster when international supply-chain conditions change.

What Policy Support Do Indian Exporters Need?

FIEO has called for continued government and industry support to sustain the current export momentum.
Key areas requiring attention include:
For smaller exporters and MSMEs in particular, access to affordable finance and efficient logistics can play an important role in maintaining competitiveness.

What Does the Record July Export Figure Mean for India?

India’s July export performance provides a positive signal for the country’s external trade outlook.
The combination of strong merchandise exports, rising non-petroleum exports and broader geographical diversification suggests that Indian exporters are adapting to a rapidly changing global trade environment.
However, the faster pace of import growth and the widening trade deficit remain areas that policymakers will need to monitor closely.
Sustaining export growth will require more than strong demand. India will also need competitive logistics, reliable infrastructure, efficient customs processes, access to finance and continued investment in manufacturing and value-added production.

Outlook: Can India Sustain Export Momentum?

The immediate outlook remains positive, but external risks are significant.
Geopolitical tensions, freight-rate volatility, shipping disruptions and evolving trade policies could influence India’s export performance in the coming months.
Greater diversification of products and markets could help Indian exporters reduce these risks.
For logistics and supply-chain companies, the growing scale of India’s international trade also creates opportunities to improve freight visibility, shipment automation, digital documentation, freight cost management and end-to-end supply-chain coordination.
India’s record July export performance therefore represents not only a trade milestone but also a broader opportunity to strengthen the country’s position in global supply chains.

Frequently Asked Questions

What were India’s merchandise exports in July 2026?
India’s merchandise exports reached US$44.24 billion in July 2026, registering growth of more than 19% year-on-year.
Yes. July 2026 recorded India’s highest-ever merchandise export value for the month of July, at US$44.24 billion.
India’s merchandise exports increased 17.04% to US$173.78 billion during April-July 2026-27.
India recorded a merchandise trade deficit of US$31.98 billion in July 2026, with merchandise imports reaching US$76.22 billion.
Engineering goods, petroleum products, electronic goods, drugs and pharmaceuticals, chemicals, gems and jewellery, readymade garments, textiles, rice and plastic products were among the major export categories.
The United States, UAE, Singapore, China, Netherlands, UK, Germany, South Africa, Bangladesh and Tanzania were among the leading export destinations during April-July 2026-27.
Higher exports can increase demand for international freight forwarding, shipping, customs clearance, warehousing, cargo tracking, documentation and multimodal logistics services.

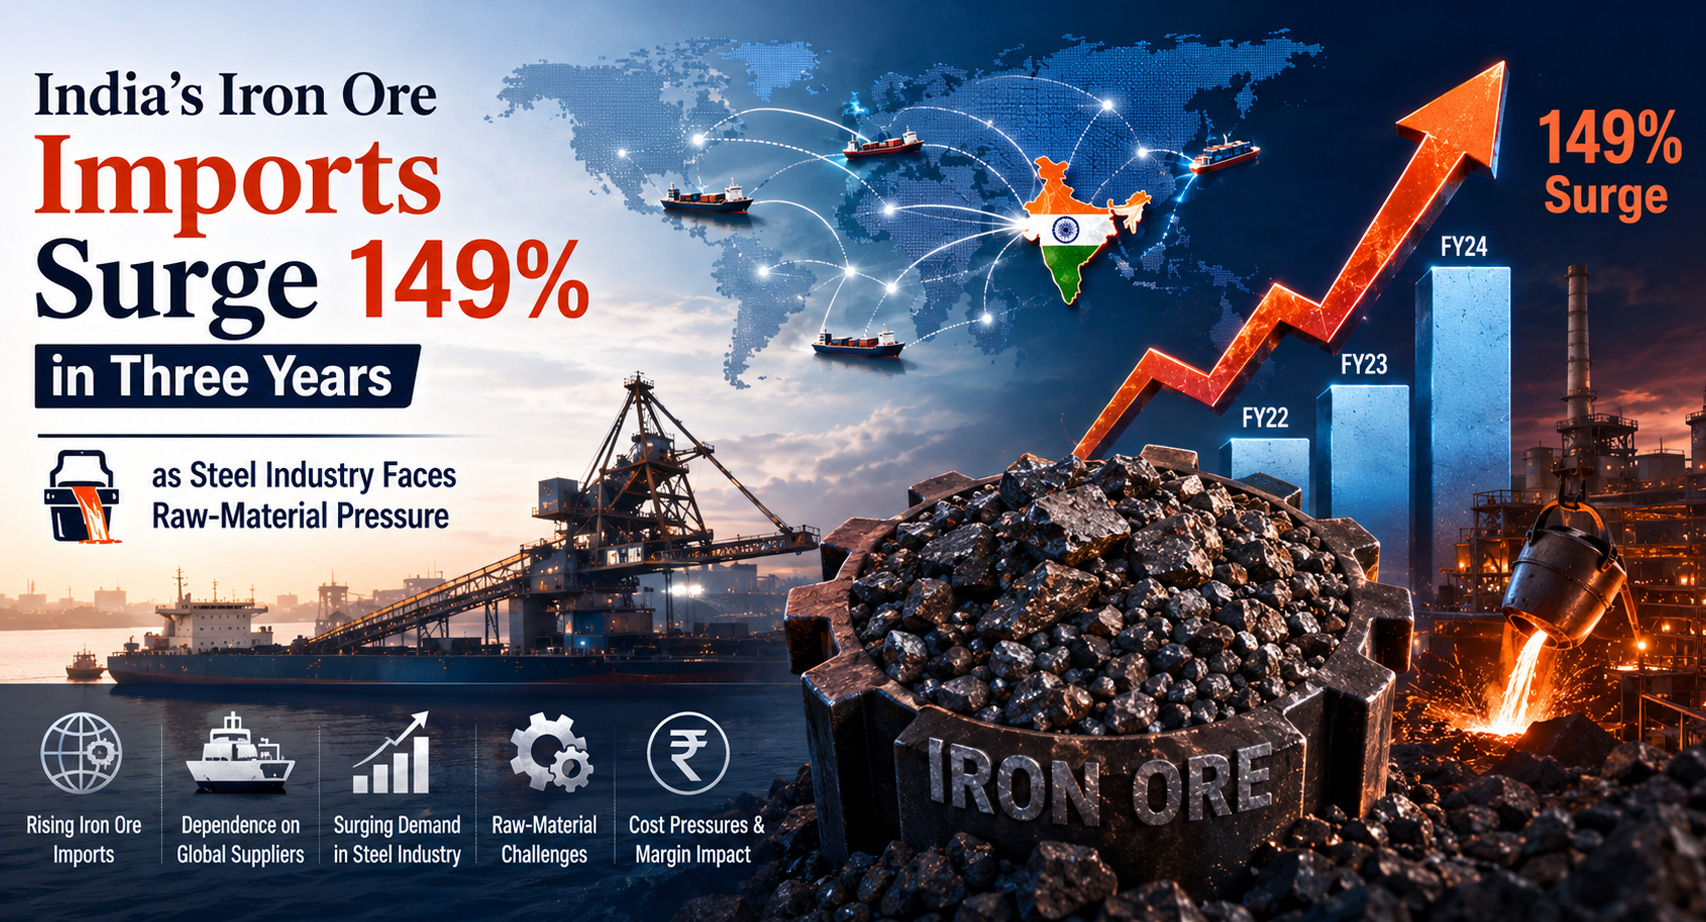
India’s Iron Ore Imports Surge 149% in Three Years as Steel Industry Faces Raw-Material Pressure

India’s iron ore and pellet imports have surged nearly 149% in three years, highlighting growing raw-material requirements as the country’s steel industry expands. Imports increased from 4.9 million tonnes to 12.2 million tonnes, according to data presented by the Ministry of Steel in the Lok Sabha.
The sharp rise points to a widening challenge for India’s steel supply chain: how to match rapidly growing steelmaking capacity and demand with reliable, cost-effective domestic supplies of key raw materials.
Higher input costs, logistics expenses, fuel shortages and constraints in raw-material availability are adding further pressure on steel manufacturers and the wider industrial logistics network.

Key Highlights

India’s Iron Ore Import Growth at a Glance

Parameter

Earlier Level

Latest Level

Change

Iron ore & pellets

4.9 million tonnes

12.2 million tonnes

1.49

Coking coal

58 million tonnes

66 million tonnes

0.138

Ferrous scrap

9.5 million tonnes

7.7 million tonnes

-19%

Why Are India’s Iron Ore Imports Rising?

1. Expanding Steel Production
India’s steel industry continues to expand alongside infrastructure development, construction, manufacturing and other industrial activities.
The increase in finished steel production in May 2026 indicates continued strength in domestic steel output. As steelmakers expand production, their requirement for iron ore, pellets and other inputs also increases.
2. Availability of Specific Grades
Domestic iron ore production does not always provide the specific grades, qualities or characteristics required by individual steel plants.
Imports can therefore help steelmakers bridge supply gaps and maintain production when suitable domestic material is unavailable or commercially less attractive.
3. Rising Logistics and Input Costs
Steel manufacturers are also dealing with higher logistics and input costs. Transportation expenses are particularly important because iron ore, coal and other bulk materials require large-scale movement between mines, ports, processing facilities and steel plants.
Efficient rail, road and port connectivity can therefore play a critical role in controlling the delivered cost of raw materials.
4. Fuel and Supply-Chain Constraints
Fuel shortages and wider supply-chain disruptions have added pressure to the steel sector.
When domestic supply becomes constrained, imports can provide an alternative source of raw materials. However, greater import dependence also increases exposure to international commodity prices, ocean freight rates, port congestion and global supply disruptions.

Coking Coal Imports Also Increase

India’s dependence on imported raw materials is not limited to iron ore and pellets.
Coking coal imports increased from 58 million tonnes to 66 million tonnes, representing growth of approximately 13.8% over the period.
Coking coal is a critical input for conventional blast-furnace-based steelmaking, making its availability strategically important for India’s steel supply chain.

Ferrous Scrap Imports Move in the Opposite Direction

While iron ore and coking coal imports increased, ferrous scrap imports declined.
Imports fell from 9.5 million tonnes to 7.7 million tonnes, a reduction of nearly 19%.
This contrasting trend highlights how different steelmaking routes and raw-material requirements are evolving within India’s steel industry.

What Does the Rise in Iron Ore Imports Mean for Logistics?

The increase in imported iron ore and pellets has implications beyond the steel industry. It creates additional requirements across India’s maritime, port, rail, road and inland logistics networks.
A sustained increase in imports could therefore create additional demand for bulk cargo handling, port infrastructure, rail evacuation, warehousing and multimodal transportation capacity.

Steel Production Continues to Grow

Despite raw-material and supply-chain challenges, India’s steel production continued to increase.

Production Indicator

May 2026 Growth YoY

Crude steel production

0.014

Finished steel production

0.059

The stronger increase in finished steel production indicates continued activity across downstream steel markets, including construction, infrastructure, engineering and manufacturing.

The Bigger Supply-Chain Challenge

The latest import figures reveal a broader structural issue for India’s steel industry.
For steelmakers, securing raw materials is increasingly becoming a logistics and supply-chain management challenge, not simply a procurement issue.
Reliable port capacity, efficient cargo evacuation, predictable rail availability and optimized inland transportation can help reduce the landed cost of imported raw materials.

Government Measures to Support the Steel Sector

The government has been working to address challenges related to:
Strengthening domestic raw-material availability while improving logistics infrastructure will remain important as India’s steelmaking capacity expands.

What Could Happen Next?

The trajectory of iron ore imports will depend on several factors, including:
If domestic steel production continues to expand faster than the availability of suitable raw materials, imports could remain an important component of India’s steel supply chain.

Key Takeaway

India’s 149% increase in iron ore and pellet imports over three years is a significant signal for the country’s industrial and logistics sectors.
The rise reflects a combination of strong steel demand, expanding production capacity, raw-material availability challenges and the need for specific ore grades.
For India’s logistics ecosystem, the development reinforces the importance of efficient bulk cargo handling, port infrastructure, rail freight, road transportation and multimodal connectivity.
As India moves toward higher steel production, building a reliable and cost-efficient raw-material supply chain will be critical to maintaining the competitiveness of the country’s steel industry.

Frequently Asked Questions

Why have India’s iron ore imports increased?
India’s iron ore and pellet imports have increased due to rising steel production and demand, availability constraints for certain grades of domestic ore, and broader raw-material and supply-chain pressures.
Imports increased from 4.9 million tonnes to 12.2 million tonnes, representing growth of nearly 149% over the three-year period.
Coking coal imports increased from 58 million tonnes to 66 million tonnes, representing growth of approximately 13.8%.
No. Ferrous scrap imports declined from 9.5 million tonnes to 7.7 million tonnes, a decrease of nearly 19%.
Iron ore imports require extensive maritime and inland transportation involving bulk carriers, ports, cargo terminals, railways, roads, storage facilities and steel plants.
Crude steel production increased 1.4% year-on-year, while finished steel production increased 5.9% in May 2026.

Maharashtra Leads India’s Pharma Exports with USD 5.94 Billion in FY2025-26

Maharashtra has strengthened its position as India’s leading pharmaceutical export hub, with pharma exports reaching USD 5.94 billion in FY2025-26. The state accounted for approximately 19% of India’s total pharmaceutical exports, highlighting its growing importance to India’s global healthcare supply chain.
The performance reflects Maharashtra’s combination of pharmaceutical manufacturing capacity, research capabilities, skilled talent and multimodal logistics infrastructure. The state has emerged as a critical link between Indian pharmaceutical producers and international healthcare markets.

Key Highlights

Why Maharashtra Is Emerging as a Pharma Export Powerhouse

Maharashtra has developed one of India’s most diversified pharmaceutical ecosystems. The state’s manufacturing base is supported by pharmaceutical companies, research institutions, industrial clusters and a large pool of skilled professionals.
Its production capabilities span several high-value pharmaceutical categories, including:

Pharmaceutical Segment

Export Importance

Generic medicines

Large international demand for affordable medicines

Active Pharmaceutical Ingredients (APIs)

Critical input for global drug manufacturing

Vaccines

Important component of global healthcare supply chains

Biosimilars

Growing demand in international markets

Specialty pharmaceuticals

Higher-value and technology-intensive products

This combination allows Maharashtra to serve multiple international markets while supporting India’s broader ambition to become a global pharmaceutical manufacturing centre.

Logistics Infrastructure Gives Maharashtra an Export Advantage

For pharmaceutical exporters, manufacturing capacity alone is not enough. Temperature-sensitive and time-critical products require reliable transportation, port connectivity, air cargo infrastructure and efficient customs processes.
Maharashtra benefits from an extensive multimodal logistics network connecting manufacturing clusters with international gateways.

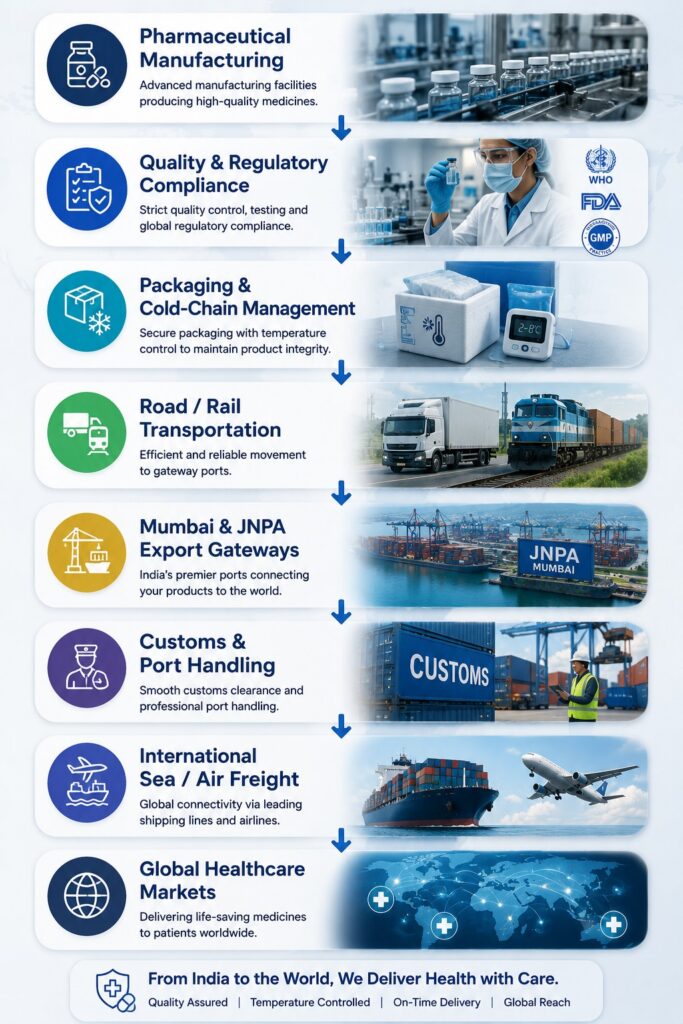
Pharma Export Logistics Flow

This connectivity can help pharmaceutical manufacturers move products from production centres to international markets more efficiently.

Maharashtra’s Role in India’s Global Pharmaceutical Supply Chain

The state’s pharmaceutical export strength also contributes to India’s integration into global healthcare supply chains.
Policy support + Manufacturing capacity + R&D + Logistics connectivity = Stronger Pharma Export Competitiveness
Government initiatives such as the Production Linked Incentive (PLI) programme, bulk drug parks and measures aimed at improving the business environment have supported investment and manufacturing expansion across India’s pharmaceutical sector.
For Maharashtra, these initiatives complement an already established industrial ecosystem and logistics network.

Major Export Markets

Maharashtra’s pharmaceutical products reach several important international markets.

Region

Strategic Importance

United States

One of the world's largest pharmaceutical markets

Europe

Major market for medicines and healthcare products

Africa

Strong demand for affordable medicines

Latin America

Expanding pharmaceutical trade opportunities

Asia

Growing healthcare and pharmaceutical demand

The continued demand for affordable and quality medicines creates opportunities for Maharashtra-based manufacturers to expand their international presence.

What Could Drive the Next Phase of Growth?

Maintaining export leadership will depend increasingly on more than manufacturing scale.
Key areas likely to influence Maharashtra’s future pharmaceutical competitiveness include:

Logistics Is Becoming a Strategic Advantage

The Maharashtra pharma story demonstrates an important shift in India’s export economy: manufacturing and logistics are increasingly interconnected.
A pharmaceutical product may be manufactured in an industrial cluster, transported through road or rail networks, processed at a port or air-cargo facility and finally delivered to a healthcare market thousands of kilometres away.
The efficiency of that entire chain can influence export competitiveness.

Conclusion

Maharashtra’s USD 5.94 billion pharmaceutical exports in FY2025-26 underline the state’s importance in India’s global pharmaceutical trade.
Its combination of manufacturing clusters, research capabilities, skilled workforce and multimodal logistics infrastructure provides a strong foundation for continued export growth.
As global demand for medicines and healthcare products increases, Maharashtra is well positioned to remain a key pharmaceutical export gateway for India.

Frequently Asked Questions

How much pharmaceutical did Maharashtra export in FY2025-26?
Maharashtra recorded pharmaceutical exports worth approximately USD 5.94 billion during FY2025-26.
Maharashtra accounted for approximately 19% of India’s total pharmaceutical exports during FY2025-26.
Its importance comes from the combination of pharmaceutical manufacturing, research institutions, skilled talent, industrial clusters and multimodal logistics infrastructure.
Major gateways include Jawaharlal Nehru Port (JNPA) and Mumbai Port, supported by road, rail and air-cargo connectivity.
The state’s pharmaceutical ecosystem includes generic medicines, APIs, vaccines, biosimilars and specialty pharmaceutical products.

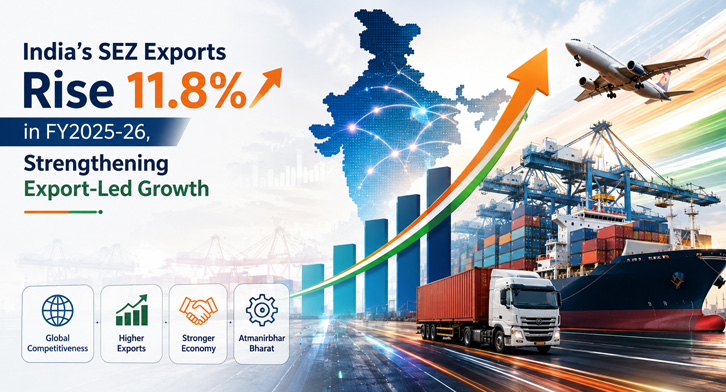
India’s SEZ Exports Rise 11.8% in FY2025-26, Strengthening Export-Led Growth

India’s Special Economic Zones (SEZs) continued to strengthen their position as major export hubs in FY2025-26, with exports rising 11.8% year-on-year to approximately ₹16.89 lakh crore.
The growth highlights the growing contribution of SEZs to India’s manufacturing, services, employment and international trade ecosystem, particularly as the country seeks to expand its participation in global value chains.

Key Highlights

SEZ Exports Continue to Gain Momentum

Exports from India’s SEZs increased from approximately ₹15.11 lakh crore in FY2024-25 to ₹16.89 lakh crore in FY2025-26, representing an increase of around ₹1.78 lakh crore.

Indicator

FY2024-25

FY2025-26

Change

Change

₹15.11 lakh crore

₹16.89 lakh crore

0.118

Cumulative investment

—

₹7.5+ lakh crore

—

Direct employment

—

3+ million

—

The performance comes as India continues to promote export-oriented manufacturing and services while expanding trade relationships with international markets.

Which Sectors Are Driving SEZ Growth?

SEZ export activity remains diversified across technology-intensive manufacturing, services and traditional export industries.

Key contributors include:

SEZs Are Becoming More Important to India’s Manufacturing Strategy

The latest export performance is significant because SEZs are increasingly being positioned as integrated hubs for manufacturing, services, logistics and international trade.
Investment in operational SEZs has crossed ₹7.5 lakh crore, while direct employment generated by these zones has exceeded 3 million.
This combination of investment, employment and export activity creates a broader economic impact by connecting manufacturers and service providers with ports, airports, logistics operators, customs facilities and international markets.

Policy Reforms Could Shape the Next Phase

The government has continued to focus on improving the SEZ ecosystem through measures aimed at simplifying regulations, improving infrastructure and making it easier for businesses to operate.
Potential modernization of the SEZ framework could further improve India’s ability to attract:

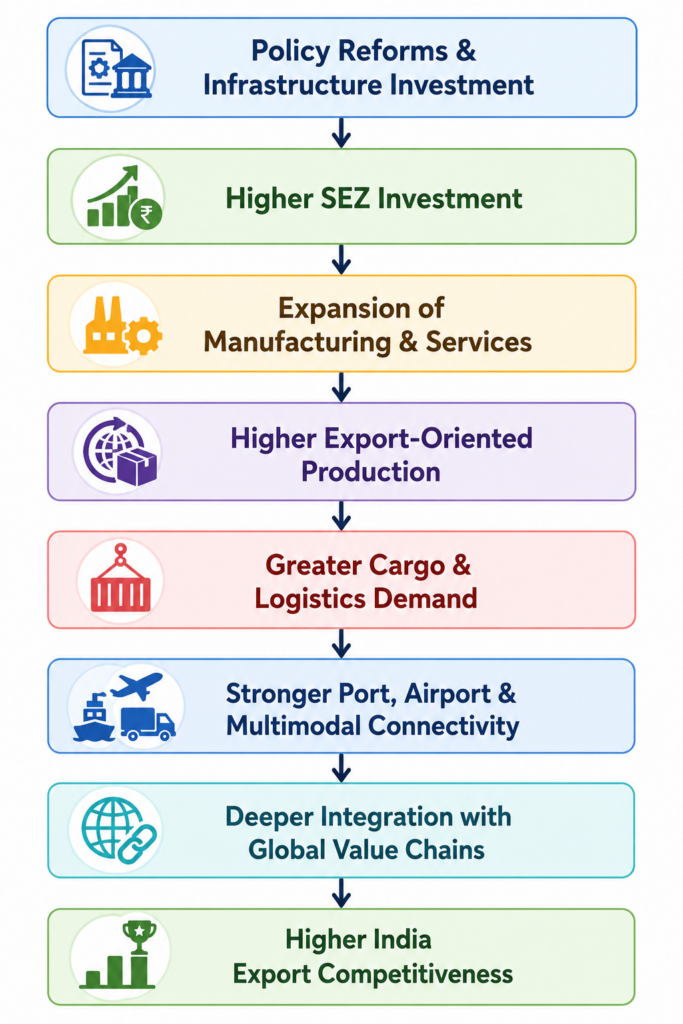
SEZ Export Growth: Impact Chain

What This Means for Logistics

The expansion of SEZ exports could generate additional demand across India’s logistics ecosystem.
Higher production and international shipments can translate into increased requirements for freight forwarding, customs clearance, warehousing, container transportation, port handling and cargo visibility.
For logistics companies, the growth of export-oriented industrial clusters also creates opportunities to provide integrated services connecting SEZ manufacturers with ports, airports and overseas markets.

Outlook

India’s 11.8% SEZ export growth in FY2025-26 points to continued momentum in the country’s export-oriented industrial ecosystem.
As India expands FTAs, promotes domestic manufacturing and seeks a larger role in global value chains, SEZs could become increasingly important hubs for international trade, manufacturing and logistics.
The next phase of SEZ development will depend on how effectively policy reforms, infrastructure investment, technology adoption and global trade opportunities are combined to create a more competitive export ecosystem.

Frequently Asked Questions

How much did India’s SEZ exports grow in FY2025-26?
India’s SEZ exports increased by 11.8% year-on-year in FY2025-26.
SEZ exports reached approximately ₹16.89 lakh crore during FY2025-26.
Major sectors include IT/ITeS, engineering goods, pharmaceuticals, electronics, chemicals, textiles, and gems and jewellery.
Cumulative investment in operational SEZs has crossed ₹7.5 lakh crore.
Growing SEZ production and exports can increase demand for freight forwarding, customs clearance, warehousing, container transport, port services and multimodal logistics.

India-Oman CEPA: Import Quota Window Opens for 30 Products in FY 2026-27

India has opened the application window for tariff-rate quotas (TRQs) covering 30 products under the India-Oman Comprehensive Economic Partnership Agreement (CEPA) for the financial year 2026-27.
The move gives eligible Indian importers an opportunity to access specified Omani products at preferential customs duty rates, including reduced or zero-duty treatment depending on the applicable product category and quota allocation.
The development is particularly relevant for businesses sourcing metals, petrochemicals, agricultural products and industrial raw materials from Oman.

Key Highlights

Which Products Are Covered?

The quota-based concessions cover products from several sectors, including agriculture, metals and petrochemicals.

Sector

Examples of Products Covered

Potential Importer Benefit

Agriculture

Dates

Preferential tariff access

Minerals & Construction

Marble

Lower import costs

Copper

Copper weld wire

Reduced input costs

Aluminium

Ingots, billets and wires

Support for manufacturing

Petrochemicals

Ethylene glycol

Lower raw-material costs

Petrochemicals

Linear alkylbenzenes

Preferential sourcing

Plastics & Polymers

LDPE

Potential reduction in landed cost

The applicable concession depends on the product, quota allocation and conditions prescribed under the CEPA/TRQ framework.

Why the Import Quota Matters for Indian Businesses

Tariff concessions can have a direct impact on the landed cost of imported raw materials.
For manufacturers, processors and distributors, lower customs duties can improve sourcing economics and potentially strengthen margins. The impact could be particularly relevant for industries that depend on aluminium, petrochemical feedstocks, polymers and other industrial inputs.
For importers, however, simply having a preferential tariff available does not guarantee the benefit. Businesses need to meet the applicable eligibility, quota allocation, documentation and customs requirements.

India-Oman CEPA and the Logistics Opportunity

The India-Oman CEPA came into force on June 1, 2026, creating a new framework for expanding bilateral trade.
For the logistics sector, increased utilisation of the agreement could generate additional demand across several parts of the supply chain:
As trade volumes increase, logistics providers may see opportunities in ocean freight, customs brokerage, port handling, warehousing, inland transportation and supply-chain management.

What Importers Should Check

Businesses planning to source eligible products from Oman should pay particular attention to:

What This Means for the Logistics Industry

What This Means for the Logistics Industry The implementation of tariff concessions can influence logistics decisions well beyond customs duty savings.
Lower import costs may encourage companies to reassess their sourcing strategies and increase procurement from Oman where commercially viable. This could affect shipping volumes, port operations, inventory planning and warehouse requirements.
For freight forwarders and customs specialists, CEPA-linked imports could also create opportunities to help customers manage origin documentation, tariff classification, quota utilisation and customs compliance.

India-Oman Trade: A Strategic Supply-Chain Link

Oman occupies an important position in India’s wider Gulf and Indian Ocean trade network. Greater use of the CEPA framework could strengthen commercial connections between the two markets while supporting diversification of sourcing channels.
For Indian manufacturers, the agreement could provide another route for securing key industrial inputs. For Omani exporters, preferential access can improve their competitiveness in the Indian market.
The result could be deeper cooperation across manufacturing, metals, petrochemicals, agriculture, logistics and related services.

Bottom Line

The opening of the India-Oman CEPA import quota window for 30 products is an important step in putting the bilateral trade agreement into practical use.
For Indian importers, the immediate priority is to understand quota eligibility, product classification, origin requirements, documentation and applicable preferential duties.
For the logistics industry, greater utilisation of the agreement could translate into new opportunities across freight forwarding, customs clearance, port handling, warehousing and inland transportation as India-Oman trade flows expand.
For businesses importing from Oman, the key question is no longer simply whether CEPA offers a tariff advantage — it is whether the available quota and compliance requirements can be effectively incorporated into their sourcing and logistics strategy.

Frequently Asked Questions

What is the India-Oman CEPA?
The India-Oman CEPA is a bilateral trade agreement designed to improve market access and strengthen economic relations between India and Oman through preferential trade arrangements.
The latest quota exercise covers 30 products for FY 2026-27.
A tariff-rate quota, or TRQ, allows a specified quantity of a product to enter a country at a preferential tariff rate, subject to the conditions of the applicable trade agreement and quota allocation.
The listed products include dates, marble, copper weld wire, aluminium ingots, billets and wires, along with selected petrochemical products such as ethylene glycol, linear alkylbenzenes and LDPE.
No. Importers must meet the prescribed eligibility requirements and obtain the relevant quota allocation. The applicable conditions should be verified before shipment and customs clearance.
Preferential tariffs can potentially reduce the landed cost of eligible imported raw materials and improve sourcing efficiency for industries dependent on Omani products.

JNPA SEZ Becomes 100% Green SEZ, Setting a New Standard for Sustainable Industrial Development

JNPA SEZ Achieves 100% Green SEZ Status

JNPA SEZ has reached a major sustainability milestone by achieving 100% Green Special Economic Zone (SEZ) status, strengthening its position as an emerging model for environmentally responsible industrial development in India.
The achievement comes as India’s logistics, manufacturing and port-led infrastructure sectors increasingly focus on reducing carbon emissions while maintaining economic growth. JNPA SEZ’s approach combines green infrastructure, sustainable mobility and large-scale urban forestry to create a more environmentally resilient industrial ecosystem.

Key Highlights

2 Lakh+ Miyawaki Trees Strengthen the Green Infrastructure

One of the most notable components of JNPA SEZ’s sustainability strategy is its extensive Miyawaki plantation initiative.
More than 2,00,000 Miyawaki trees have been planted, helping create dense green areas within the industrial ecosystem. Miyawaki forests can support biodiversity, improve local air quality and contribute to carbon absorption.
This initiative is particularly significant for industrial zones, where balancing infrastructure expansion with environmental protection is becoming increasingly important.

EV Mobility Adds a New Dimension to Green Logistics

JNPA SEZ has also introduced electric vehicle-powered mobility solutions within the zone.
The move reflects a broader shift toward cleaner transportation across India’s logistics ecosystem. As ports, warehouses, industrial parks and distribution centres increasingly adopt electric mobility, EV infrastructure could become an important component of India’s future low-carbon logistics network.

How JNPA SEZ's Green Model Works

Sustainability Initiative

Potential Impact

Miyawaki plantations

Biodiversity, green cover and carbon sequestration

EV-powered mobility

Lower-emission transportation

Green infrastructure

Reduced environmental footprint

Sustainable industrial planning

Greater long-term resilience

Eco-friendly operations

More resource-efficient industrial ecosystem

Why This Matters for India's Logistics Sector

The significance of JNPA SEZ’s achievement extends beyond a single industrial zone.
India is expanding its logistics and manufacturing infrastructure to support economic growth, exports and supply-chain competitiveness. At the same time, companies and infrastructure developers face growing pressure to make these facilities more sustainable.
Green industrial zones can potentially help address both objectives by combining:
Industrial Growth + Efficient Logistics + Clean Mobility + Green Infrastructure
This integrated approach could become increasingly important as India moves toward more sustainable supply chains.

JNPA SEZ: A Potential Model for Green Industrial Parks

The development demonstrates that sustainability does not necessarily have to be treated as a separate component of industrial development.
Instead, environmental considerations can be incorporated into the design and operation of industrial zones—from plantation and mobility to infrastructure and resource efficiency.

At a Glance

Parameter

JNPA SEZ Initiative

Green certification milestone

Biodiversity, green cover and carbon sequestration

Green plantation

Lower-emission transportation

Sustainable mobility

EV-powered mobility solutions

Primary focus

Green industrial development

Wider relevance

Logistics, manufacturing, ports and SEZ infrastructure

The Bigger Picture

JNPA SEZ’s green transformation comes at a time when sustainable logistics infrastructure is becoming an increasingly important competitive factor.
For India’s logistics industry, the future is likely to involve more than simply moving goods faster and at lower cost. Infrastructure will also need to become cleaner, more resilient and environmentally responsible.
JNPA SEZ’s latest milestone provides an example of how port-led industrial development can incorporate sustainability into its long-term growth strategy.

Frequently Asked Questions

What is JNPA SEZ?
JNPA SEZ is a Special Economic Zone associated with Jawaharlal Nehru Port Authority and forms part of the port-led industrial development ecosystem in Maharashtra.
JNPA SEZ has achieved 100% Green SEZ status, according to the information provided.
More than 2,00,000 Miyawaki trees have been planted as part of its green initiatives.
The SEZ has introduced electric vehicle-powered mobility solutions within the zone as part of its sustainable infrastructure strategy.
Green SEZs can help combine industrial development with environmental management by incorporating cleaner mobility, green infrastructure, biodiversity initiatives and resource-efficient practices.

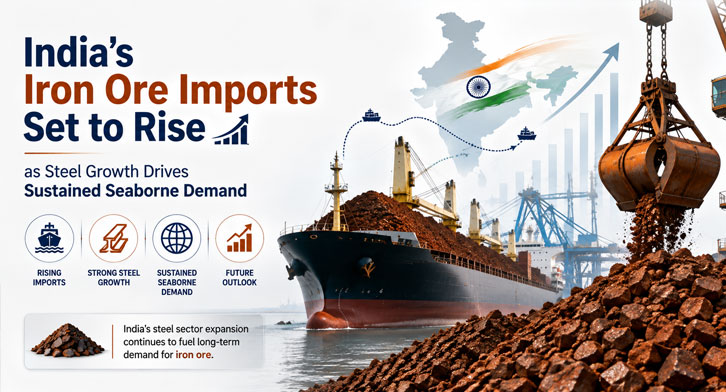
India’s Iron Ore Imports Set to Rise as Steel Growth Drives Sustained Seaborne Demand

iron-ore

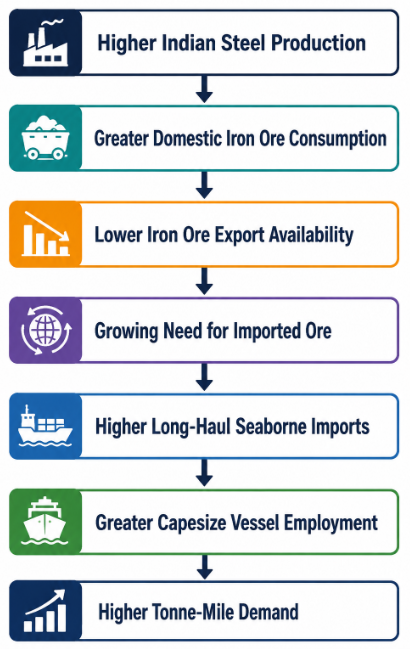
India’s iron ore trade is undergoing a significant structural shift as rapid growth in steel production increasingly absorbs domestic ore supplies and pushes steelmakers toward overseas markets.

The trend, highlighted by Drewry’s analysis of India’s iron ore trade, is becoming more pronounced as the country moves toward its ambitious steel production targets for 2030-31. With domestic steel output expanding faster than iron ore production, imported ore is expected to play a growing role in meeting future raw material requirements.

For the logistics and dry bulk shipping industry, the shift could translate into sustained seaborne iron ore demand, longer shipping routes and increased employment for Capesize vessels.

Key Highlights

India’s Steel Expansion Is Increasing Raw Material Pressure

India has emerged as the world’s second-largest steel producer, with crude steel output increasing sharply over the past five years.

Production rose from approximately 100 million tonnes in 2020 to more than 160 million tonnes in 2025, representing an annual growth rate of around 10%.

The next stage of expansion is being driven by the government’s National Steel Policy, which targets crude steel capacity of 300 million tonnes and production of 255 million tonnes by 2030-31.

Achieving these targets will require a significant increase in the availability of iron ore and other steelmaking raw materials.

While India’s iron ore production has also expanded, growing at roughly 9% annually over the same period, steel production has increased slightly faster. This divergence is gradually putting greater pressure on domestic ore availability.

India’s Iron Ore Trade Balance Is Changing

India was historically a major exporter of iron ore fines, particularly when domestic steelmakers had limited capacity to consume lower-grade material.

That situation has changed.

Investment in ore beneficiation, pelletisation and sintering has allowed domestic steel producers to use more iron ore fines within the country. Consequently, a larger share of domestically produced ore is now being consumed by Indian steelmakers rather than exported.

The change is clearly visible in India’s trade figures.

Indicator

2020

2025

Change

Crude steel production

~100 MT

>160 MT

Strong increase

Iron ore exports

52 MT

27 MT

Significant decline

Iron ore imports

—

12.1 MT

Increasing dependence

Target crude steel production

—

255 MT by 2030-31

Further expansion planned

MT = million tonnes

Iron Ore Imports Become Increasingly Important

India’s iron ore imports increased significantly as domestic steel production strengthened. Imports reached 12.1 million tonnes in 2025, while exports fell to 27 million tonnes.

This represents a major change in the country’s iron ore trade structure.

Rather than relying primarily on domestically produced ore, Indian steelmakers are increasingly using imports to supplement domestic supplies. Competitive international ore prices have also supported the shift toward overseas sourcing.

The development could become even more important as steel production continues to expand toward the government’s 2030-31 target.

What This Means for Global Dry Bulk Shipping

India’s changing iron ore trade has implications well beyond the domestic steel industry.

As more Indian-produced ore is consumed domestically, imports are likely to become an increasingly important source of incremental supply. This could create additional demand for seaborne iron ore transportation.

Brazil is already an important supplier to the Indian market. Brazilian cargoes typically involve long-haul voyages to India, generating substantially more tonne-miles than shorter regional routes.

Higher volumes from Brazil and other distant suppliers could therefore have a greater impact on the dry bulk shipping market than the volume increase alone would suggest.

How India’s Steel Growth Is Driving Seaborne Iron Ore Demand
Steel Growth

Why Capesize Demand Could Increase

Iron ore is one of the major commodities transported by Capesize bulk carriers. These vessels are particularly suited to large-volume, long-distance movements between major mining regions and steelmaking markets.

If India increasingly sources iron ore from Brazil and other distant suppliers, the resulting longer voyages could increase vessel utilisation and tonne-mile demand.

For shipowners, charterers and dry bulk operators, India’s steel expansion could therefore become an important factor supporting future iron ore shipping demand.

A Structural Change, Not a Short-Term Trend

The evolution of India’s iron ore market points to a broader structural transformation.

Growing steelmaking capacity, greater domestic consumption of iron ore fines and investments in beneficiation and pelletisation are reducing the amount of ore available for export.

At the same time, India’s ambitious steel production targets are likely to increase the country’s requirement for raw materials.

This combination could make imported iron ore an increasingly important component of India’s steel supply chain.

Outlook for India’s Iron Ore Trade

India’s steel industry is entering a new phase of expansion, and ensuring adequate raw material supplies will be critical to achieving the country’s 2030-31 production ambitions.

With domestic iron ore increasingly being absorbed by Indian steelmakers, imports are expected to play a larger role in meeting incremental demand.

For the logistics and maritime sectors, this could mean more seaborne iron ore cargoes, longer-haul trade routes and sustained demand for Capesize vessels.

India’s evolving position in the global iron ore market could therefore become an increasingly important driver of dry bulk shipping demand over the coming years.

FAQs

Why are India’s iron ore imports increasing?

India’s iron ore imports are increasing as domestic steel production grows and a larger share of locally produced ore is consumed by domestic steelmakers. Investments in beneficiation, pelletisation and sintering have also increased the ability of Indian mills to use iron ore fines.

India imported approximately 12.1 million tonnes of iron ore in 2025, according to the data cited in the analysis.

Iron ore exports have declined because more domestically produced ore is being consumed by Indian steelmakers. Rising domestic steel production and improved processing capabilities have reduced the amount of ore available for export.

India’s target of 255 million tonnes of crude steel production by 2030-31 is expected to significantly increase demand for iron ore and other steelmaking raw materials.

Higher iron ore imports could increase demand for seaborne transportation. Long-distance shipments from suppliers such as Brazil could particularly benefit Capesize vessels by increasing vessel utilisation and tonne-mile demand.

If iron ore imports continue to rise, India could become an increasingly important destination for Capesize vessels, particularly for long-haul cargoes from major exporting countries.

cargonet-logo-icon
Cargonet Cargo Software Logo

Feedback & Reward program

Submit the Feedback and avail the Rewards.

1. Your satisfaction & reliability on CargoNet ?

2. Your Rating on Support & co-ordination team?

3. Satisfaction on the look and feel of CargoNet ?

4. Please specify any 2 best features that you feel more helpful in CargoNet?

5. Please specify any 2 best reports that you are taking on regular basis?

6. Are you using Copy Job option in CargoNet Software?

7. Are you using Automatic DSR (Daily Status Report) Option? It automatically sends reports to customer about the shipment status

8. Are you using Automatic Outstanding Reports option? Period Auto outstanding reminders to customer

9. Any other thoughts to improve in CargoNet? Please share.

* Join our Reward Program by recommending CargoNet (Cash Rewards Awaiting)

“Thanks for your feedback. Our goal is to create the best possible product, support & service, and your thoughts, ideas & suggestions play a major role in helping us identify opportunities to improve.”

Cut AI cost,
not performance

discover how top Freight Forwarding companies  reduce AI-related expense and speed up operation with CargoNet AI, we will show it how
Share your information for instant access :